This is a web site on some Data Science topics.
It includes content that I taught during an academic course on ‘Data science in Python’ in 2022 and 2023 leading to a bachelor degree.
Update (January 2024):
At this start of 2024, I am preparing for the repetition of this course.
Part I - Getting Started with Pandas
Okay, let’s get started with the Setup 2024 for Plotly, Pandas on Ubuntu
If you are new to the topic, you might want to start here:
- Python - A refresher dedicated on use with Pandas - What to refresh from a potentially vast Python skill set?
- ‘Pandas - How do I … - How to perform fundamental changes to a dataframe?
- ‘Pandas - Rows - How to delete the last row of a Pandas dataframe?
Part II - Case Study: First Names
Most of the work might be due to mastering Pandas and fine tuning the visualizations. For providing you an overview, I moved the details to the layer below this page.
I currently recommend to split a task into steps:
- Wrangling - How to use Pandas for data wrangling?
- Visualization - How to visualize the content of a Pandas dataframe?
Part III - Modelling - Time series
- Time Series - How to work with time-dependent data?.
Part IV - Modelling - Categorizations
- Categorization - How to cluster and categorize?
Plotly
An alternative visualization using Plotly. Plotly also offers the possibility to extend graphs to a dashboard.
When selecting the number of cylinders in the drop down box, only the respective data are shown. The second graph shows the average fuel consumption.
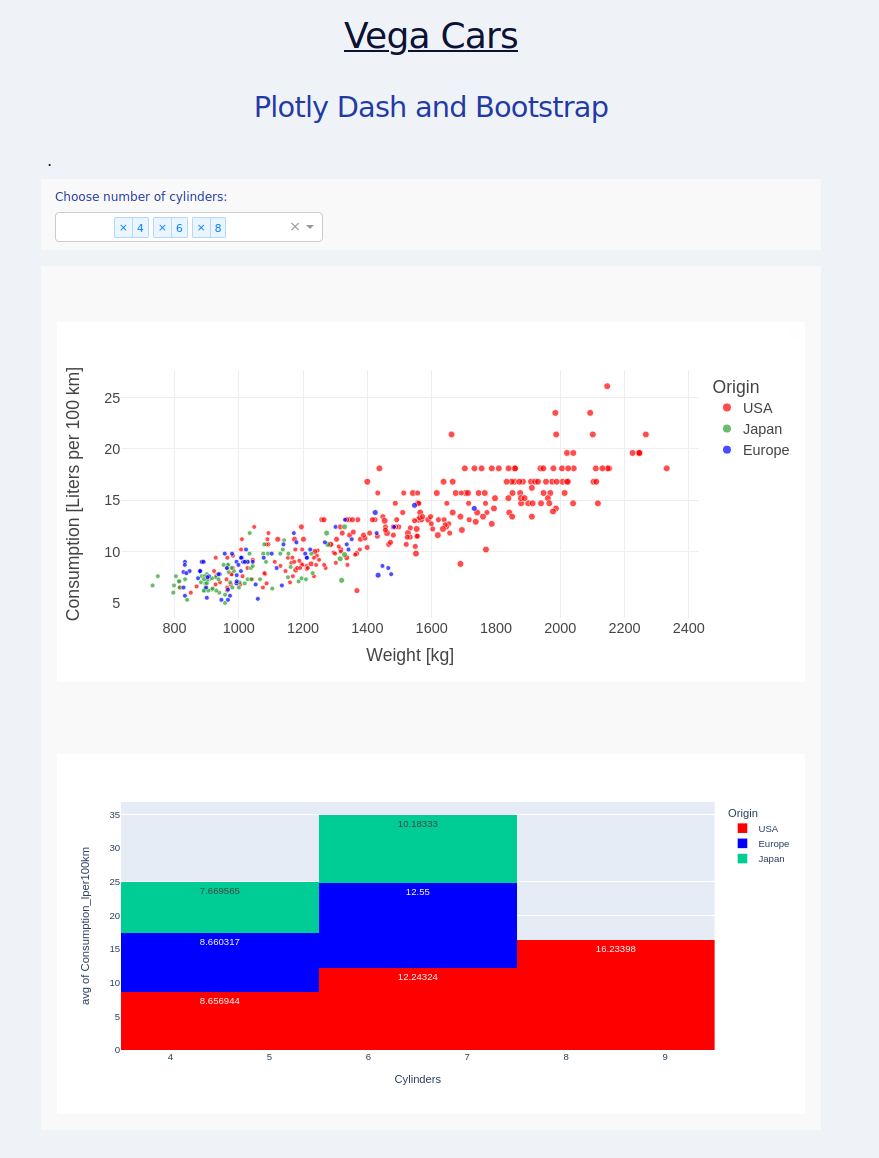
The 'cars' dataset of Vega shown in a Dashboard created with Dash.
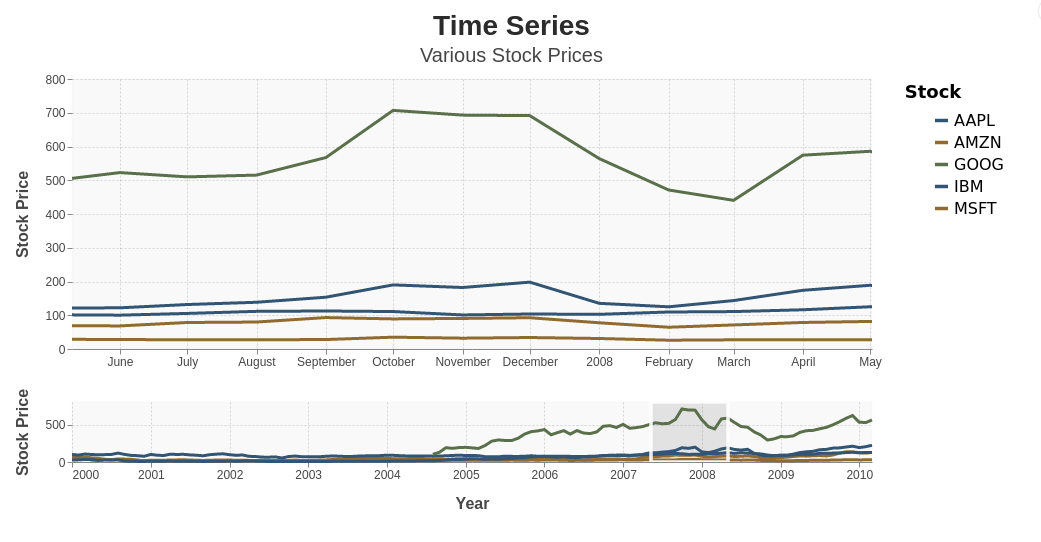
Time Series
A common use case is to predict this year’s data from last years data.
Once such a prediction was made, you might want to point out clearly the deviation of new value from the prediction.
You see here the actual value and the predicted value.
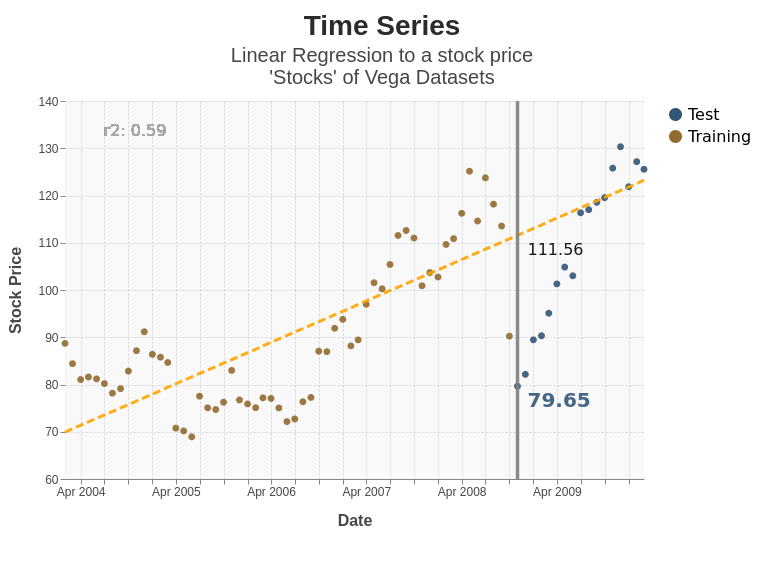
You see here the actual value and the predicted value.
Continue on Time Series …
Categorization
Some Machine Learning algorithms are shown here.
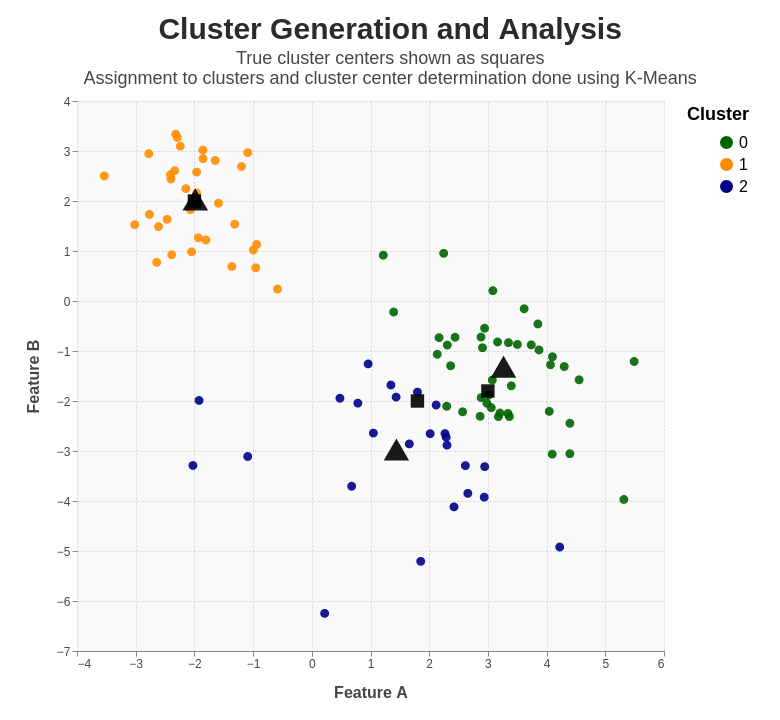
A standard example for classification.
The ‘Iris’ data is the standard data set used for clustering and classification.
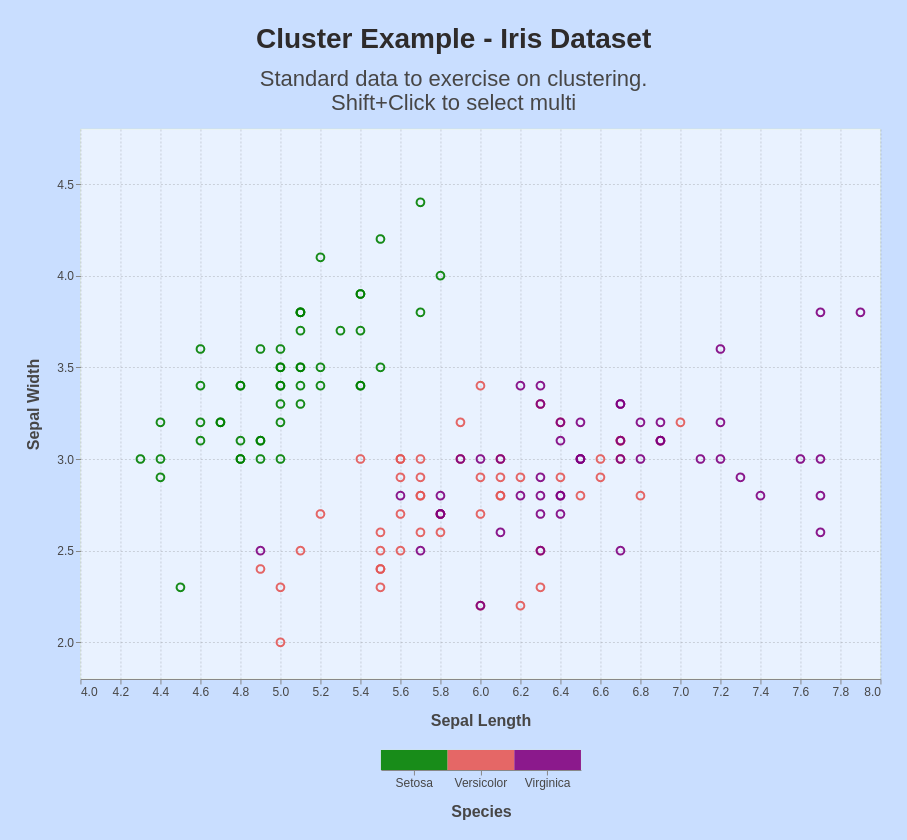
A standard example for classification.
Continue on Categorization …
Machine Learning (i.e. no neuronal networks) concludes the part on Python. (No PyTorch here.)
Julia
In 2022 and 2023, Python was sufficient for all my requirements. No updates hence on my pages on Julia dataframes. The content on Julia reflects my version and my knowledge of Julia as of 2021.
Here are the pages on Julia dataframes you were interested in 2023.
- Julia Dataframes - Columns - How to work on columns of a Julia dataframe?
- Julia Dataframes - Rows - How to work on rows of a Julia dataframes?
- Julia Dataframes - Transpose - How to transpose a Julia dataframe?
- Julia Dataframes - Operations - How to operate on a Julia dataframes?
- Julia Dataframes - Dataframe - How to work on the complete Julia dataframe?
- Julia Dataframes - Visualization - How to visualize a Julia dataframe?