Pandas and Wrangling
Let me define wrangling here as converting raw data to data stored locally for further processing and visualization.
Raw data typically means data from other sources, e.g. the internet or other systems.
The data stored should have some quality. This is the idea which led to ‘beautiful dataframes’.
Such qualities include:
- Reducing the raw data to the data in fact needed for further processing
- Reducing unnecessary accuracy of data
- Checking for consistency of the data
Particularly for the headers this means:
- Rename columns to a meaningful description of the content of the column
- Applying naming conventions to all column names, e.g. capitalize
- Reorder the columns to a meaningful or efficient way for further processing
After having worked on the dataframe, it needs to be saved such to be efficiently refound and processed by further programs, e.g. for visualization.
If you are new to this topic, you might check:
Before starting with the details of wrangling, it might be best to illustrate a possible result. The subsequent operations were necessary to achieve this result.
The data used here
In his great book “Python for Data Analysis” Wes McKinney used US Baby names to demo his library. This work inspired me to look out for European first names. I am thankful to statisticians who provide the data about Scottish first forenames.
The result of the wrangling here was a csv-file. However, this csv-file could be used to produce without many further steps the following graph.
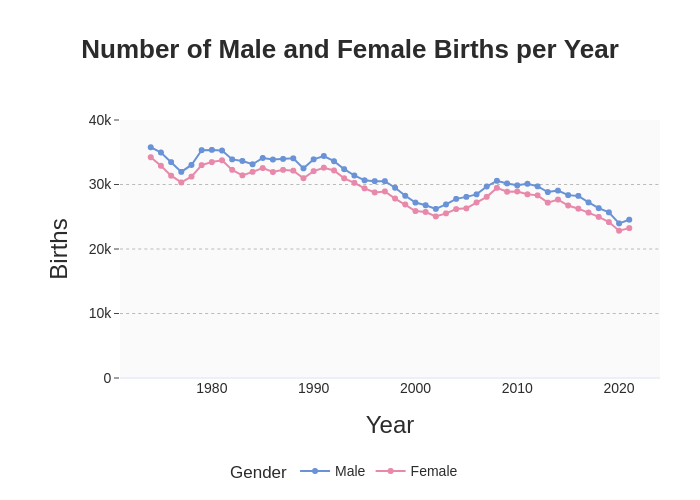
Concerning content, the graph shows a trend of decline in birth rates over time. Further, you see that the number of male babies is persistently higher than that of female babies. You can quickly infer that the total number of newborns is about 60 000 per year, which matches to a Scottish population of about 5 million.
Create the dataframe and explore it a bit
For starting to redo the above example, the first step would be to download the data from the internet site full-lists-of-babies-first-names (as of December 2022).
Unzip the file, rename it and move it to a dedicated folder.
filepath = ".../100_Raw/babies-first-names-all-names-all-years_incl_2021.csv"
Create a dataframe with these data.
df = pd.read_csv(filepath)
Explore the dataframe, e.g. using
print("Number of rows:", df.shape[0])
print("Number of columns:", df.shape[1])
This dataframe has more than 263 thousand rows in 6 columns. For performance, this will not be a problem for Python or Pandas here. The more than 12 MB memory used is also no reason to worry about.
print(df.info())
Best, you have a look at the data in the file directly, but you can also have a look using the print function.
print(df.head(10))
print(df.tail(10))
You can also have at all data, but this give you only a few of the first and last rows, though you get the number of rows and columns in addition.
print(df)
It might be better to look at a random sample size. You can fit the number of rows shown to the terminal height and run the program a few times to get an idea.
print(df.sample(23))
Reduce the raw data
Keep only the first 3 columns
df = df.iloc[:, :4]