Time Series - Updates
The task here is to update an existing time series with more data. Particularly for the use case when at the beginning of a month the data of the previous month are available.
The particular problem here is the computational effort when the aggregated data have to be re-computed from the raw data. Example: You just want to increase the size of the points in the chart, but for each re-run of the program, hundred of thousands of data have to be re-computed.
The solution below uses two files with aggregated data:
- For the past, aggregation for the year 2022
- For the update, the first months of the year 2023

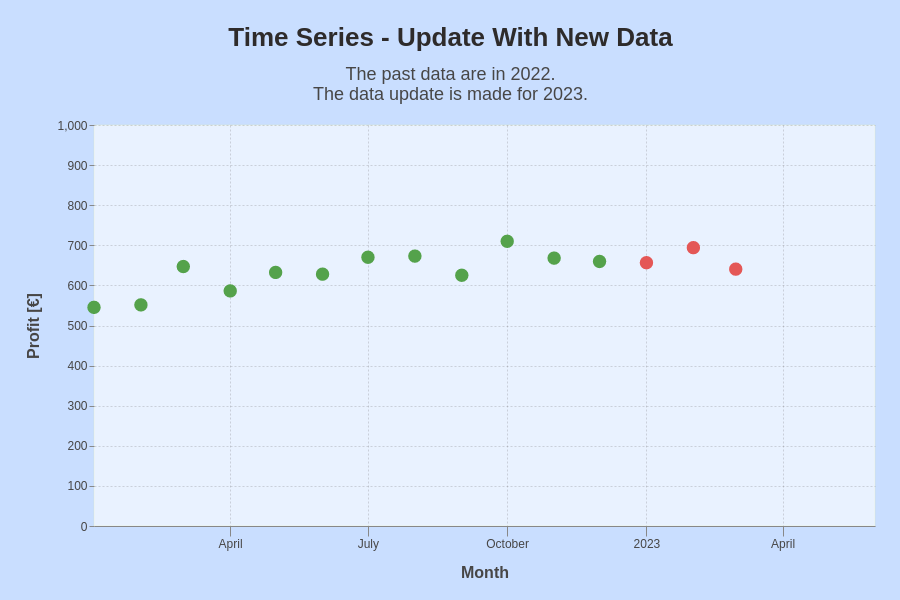
Time series with a 'profit' computed from artificial raw data. Past data (green) and updated data (red).
Some details about the example used here
The (artificial) account data in the Time Series Starter Example are used to compute an artificial ‘profit’. This computation is done using a ‘recipe’. This recipe is in the simple case time-independent, but it could also be different for any month.
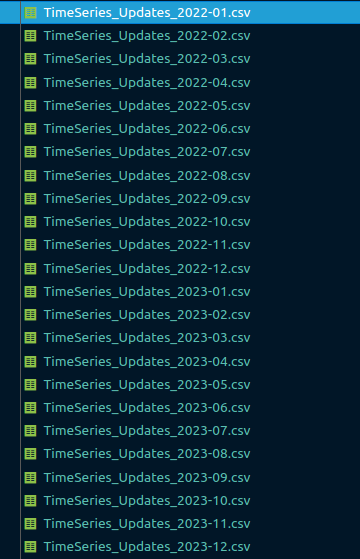
The raw data are only available as “one file per month”. Each file contains the data of 3 accounts. The task for each month is to compute the profit using a simple equation, which shall be called here a ‘recipe’. Such a recipe could be much more complex, e.g. using different weight factors or considering a varying sub-set of these accounts.

The number of files to be handled might give you a better idea of problem.
Certainly, in this artificial example, we have all data at our fingertips. However, let’s assume for a moment that we had so far only the data of 2022, but suddenly got the data for the first months of 2023.
Solution idea and some details
First of all, it should be noted that there are many solutions. Only one solution is detailed out here. It might help to think about more appropriate alternatives for specific use cases.
Create file with aggregated, monthly data
- At the core of this solution is a component that creates a ‘file with aggregated data’ from any specified number of ‘original files’.
- At the beginning of each run of the program, it is checked, if the target file exists.
- If the target file does exist, it is used, else it is created.
The solution starts with trying to find a file the the aggregated data for the specified months.
In this case, the model shall include all files of 2022. As the date is a unique part of the file name, it suffices to specify this year.
filestem = "Profit"
specList = ["2022"]
df = tsUpdate.getDFFromFile(fullpathAggr, fullpathOrg, filestem, specList, para)
For reuse, the functions are outsourced to a separate file that is imported here using the alias ‘tsUpdate’. The parameters include:
- the path to which the aggregated file shall be saved
- the path in which the original (raw) data are located
- the first part of the filename for the new file with aggregated data
- the list with the specification which original files shall be used, i.e. the year or the year and month
Re-use of an existing aggregation
Next you need to check, if the required dataframe is available, i.e. not empty. If it is empty, you need to create the new file with aggregated data.
filename = createFilename(filestem, specList)
dfL = readsave.readFindDF(fullpathAggr, filename, para)
if dfL.empty:
    fileList = getSpecificFilesFromPath(specList, fullPathOrg, para)
    dfL = getDataFromFiles(fullPathOrg, fileList, para)
    dfL = applyRecipe(dfL, para)
    fullname = readsave.saveCreateFolder(dfL, fullpathAggr, filename, para)
    ...
return dfL
All tools to create that file with aggregated data were already introduced here.
Doing the Update
For the update, all that is left to do is to call this function again, but with the specification for the update.
specList = ["2023-01", "2023-02", "2023-03"]
dfT = tsUpdate.getDFFromFile(fullpathAggr, fullpathOrg, filestem, specList, para)
The chart can of course be created in various ways. Here a second point chart using the second dataframe, i.e. dfT, was created and combined with the first chart.