Compare Two Lists - Excel vs. Python
Comparing two lists is a problem that frequently occurs.
In my real-world case, I first had those lists in Excel.
Certainly, this problem can be solved remaining in Excel. If you did so yourself, you might know the pain to get dizzy at looking at all these IDs, worrying of having made a mistake when expanding those columns - and to start all over again, when doubts occur on the correctness of your results or when the input data change a little bit.
Using Python, you can solve this problem fast, robust and with a essentially 3 lines of coding.
The Python coding outlined below run within 1 second for 100.000 IDs - returning all the info you want, ready to be used as Excel.
The difference is made by just a few Python and Python Pandas commands.
I will show you here how I solved the problem. First in Excel, then in Python.
Your respective solution in Excel might be much better than mine, but still you might want to compare it with the subsequent Python solution. I will also show how to get from Excel to Python and back.
After having gone through both solutions, we will summarize and discuss their respective benefits.
By the way, if you are not so much dealing with accounts, but with people, the problem here is straightforward to be applied to two distribution lists with emails. Just replace “ID” with “email” in the following.
Use Case
Let’s assume you are responsible for the checking of invoices. You hold a list of accounts from which you expect invoices. We name this list: A. It holds all of ‘your’ accounts with their respective IDs.
You just received a list of invoices, each coming from an account. Each account has a unique account ID. We name this list: B.
The questions you ask are as follows:
- Did I receive invoices for all of my accounts?
- Did I receive invoices for accounts that are not mine?
For me, this use case came in recently and at first surprisingly after the latest re-organization. Suddenly, expected invoices were missing - and doubt came up, if invoices from other accounts were added. Next thing I wrote was a predecessor to the example here that checks, if I got exactly those accounts on my invoice list that I had expected. Possibly, the list with my accounts has become outdated, but I still need those differences to discuss with colleagues, to open tickets and to adapt my own lists after respective decisions.
Soon after, I realized that it is not only me having this problem, but all my peers dealing with such a task of invoice checking are facing the same problem. Suddenly, all ‘internal lists’ are re-shuffled. This problem also reoccurs with each reorganization that implies a re-distribution of such accounts.
Wouldn’t it be time to work out the pattern and to come up with an efficient solution?
Specification of Problem and Solution
For the example here, I created IDs representing accounts of the following pattern:
"5cgb19c9-nxs2-c9f-xx12-894w1b894f38"
They are in fact of identical format as the ‘real accounts’ that I am dealing with.
I tried various amounts of IDs and ended up with 30 IDs, which seem to be sufficient to illustrate the points to be made here. No need to deal with my typical amounts of 80 to 800 account IDs.
Using simple random numbers, I distributed those 30 IDs either to list A, to list B or to both lists.
As a solution, I would like to have 3 lists, let’s call them, S1, S2, S3.
- S1: IDs that occur in both A and B
- S2: IDs only occurring in A
- S3: IDs only occurring in B
The problem shall be called solved, when the three lists S1, S2 and S3 are known and sufficient sample tests using search and find assure us of their correctness. Example: Take any ID from list S2 and check that it only occurs in list A, but not in list B.
A Solution in Excel
As a starting point, let’s assume we have the two lists A and B in an Excel file each.
I copied the sheet of file A and copied the content of file B into that new sheet. This is the only sheet that I am working with here. In the picture below, you see the two lists as the two left-most columns, which I labelled for more clarity as ‘List_A’ and ‘List_B’.
The common technical approach that I also have seen my colleagues doing is to use the “vlookup” command of Excel. My solutions requires as a next step an intermediate column for this vlookup command. In this intermediate column, I get all the IDs that are in list B, but not in list A. The formula looks like this:
=VLOOKUP(C3;B$3:B$30;1;FALSE)
There are several traps, you might run into when using this command.
-
First of all, in our case here you need to set the last parameter to FALSE. FALSE here means ‘exact match’.
- Next trap is to forget the “$” to fix the range specification of the searched column. If you forget that before expanding the equation to the complete column, the IDs searched get increasingly fewer - leading to a wrong result.
- Finally, you need to have the searched list sorted before you execute the vlookup command.
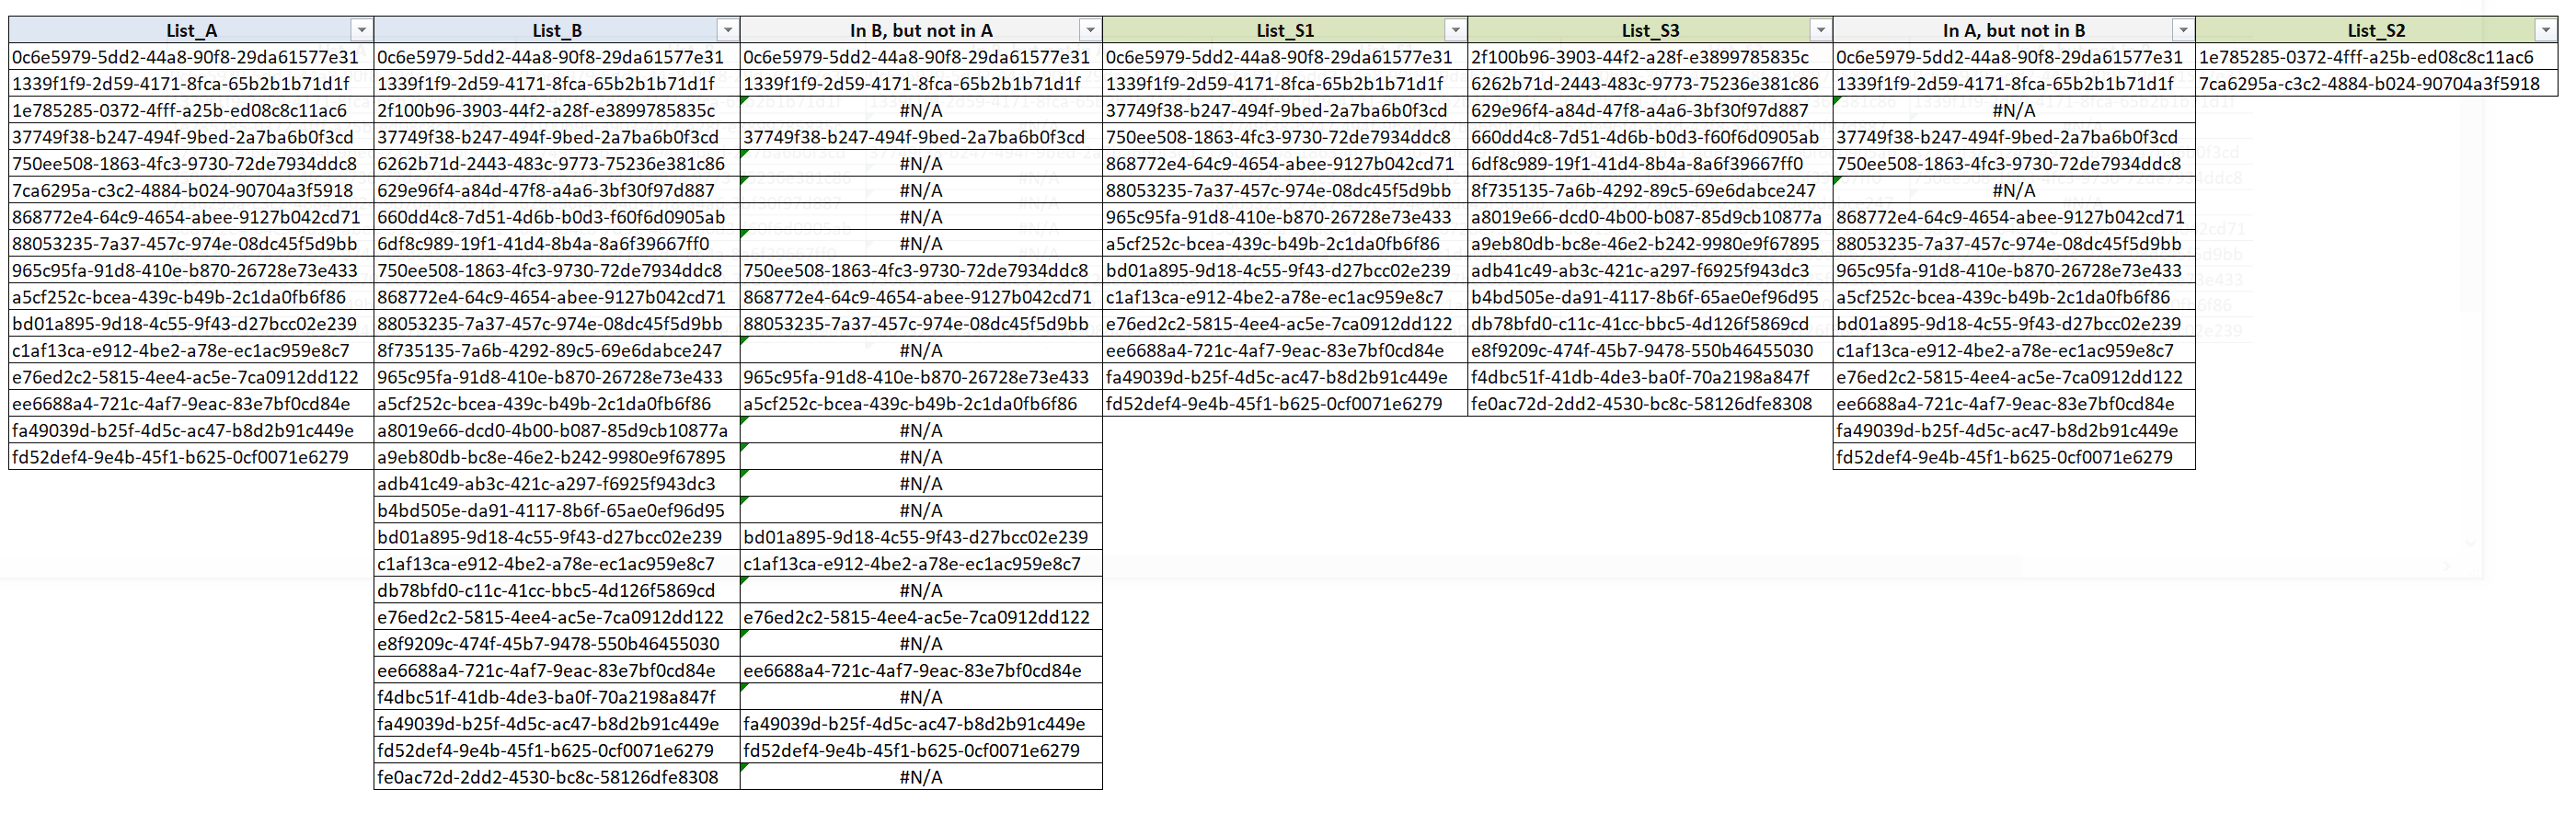
Complete problem and solution in Excel: Lists A, B, S1, S2 and S3.
Each unique ID in the second column leads to a “#N/A” in the third column. Optically, this is not a beauty, but I used it to select the desired subset by just filter off those ‘#N/A’. You can then copy and paste the content into the next column and name it rightfully S1, as it contains the shared IDs.
Repeating the filter for the complementary subset, directly leads to S3, i.e. the unique entries in list B. Getting to the unique entries in list A, however, the procedure using vlookup has to be repeated, this time with “entries in A, but not in B”. Similarly to S3, the list S2 can be obtained, which contains the unique entries in A.
Ok. We are done for the Excel solution, with S1, S2 and S3 being populated and sample checks being all good.
A Solution in Python
We start here, too, with lists A and B.
The steps used here are as follows:
- Merge the two list A and B with an inner join: Get S1
- Concat list A with S1 and delete duplicates: Get S2
- Concat list B with S1 and delete duplicates: Get S3
Here, we need to introduce Pandas which is an library for Python. Pandas is usually imported - after installation - to the respective Python program and abbreviated as “pd”. Pandas comes with so-called dataframes which hold lists.
In my example, A and B are already such dataframes, but they can also be the result of an import from Excel files - after having installed the library xlrd - using, for instance,
A = pd.read_excel(fileAbsPath, index_col=0)
where fileAbsPath is the absolute path to the Excel file. Details are given in the sources linked in the references.
No matter how we got there, we have now the two dataframes A and B. Without further ado, in fact the very next line gives us the main part of the solution:
S1 = pd.merge(A, B, how="inner", left_on="AccountID", right_on="AccountID")
In this merge, the “inner” value for the “how” parameters specifies to only merge those rows which have the same value for AccountID in both the “left” and the “right” table. It is crucial to ensure that this “inner join’ is carried out.
Lists A and B, respectively are added to the new list S1 using concatenate. Afterwards, all IDs that are not unique are deleted.
S2 = pd.concat([S1, A], axis='index').drop_duplicates(keep=False)
S3 = pd.concat([S1, B], axis='index').drop_duplicates(keep=False)
All entries that only occur in A can only occur only once in table S1 - as S1 contains only those that also occur in B. Deleting all entries that have more than one occurrence thus leaves S2 with only the subset available in table A only.
Pandas’ drop_duplicates command does not need the tables to be sorted. This is a nice feature - compared to a “delete_adjacent_duplicates” command - which also happens to makes this coding much more concise.
You see that after 3 lines of code, the tables S1, S2, S3 hold the entire solution. Isn’t this amazing?
All the rest of my example program is data preparation and printouts. Nothing missing here, hence, as everybody has a personal style of doing such console outputs. In particular, all 5 dataframes can easily be saved either as 5 Excel files or as one Excel file with 5 sheets. The decisive step is to use the Excel writer:
writer = pd.ExcelWriter(fileAbsPath, engine="xlsxwriter")
The details are given in the references, as they are not the focus here.
Combining the solution with the original lists
We walked through the key steps of two independent solutions to come up with the identical result which consisted of holding two lists with unique IDs and one list with common IDs.
In the original problem, two lists, A and B, were connected to other data. Table A in my case to a semantic list of ‘my’ accounts, holding email addresses of people I know. The other table was connected to invoices. In the (artificial) example here, this would mean to not having received invoices for 2 accounts, but to have received invoices for 14 out-of-group accounts. How to send back an Excel discussing those 14 accounts?
Honestly, I am short of a great answer for Excel. You can of course repeat the vlookup solution again, with the account IDs in the invoices being probed against table S3. You then get again hits and throw out the “#N/A”. With hundreds of rows for the invoices this might not a be your solution of choice.
You might be fascinated - as I certainly was - how easy this problem is solved using Python Pandas. The original table is copied and truncated to only hold the account IDs. If df_Invoices is the Pandas dataframe that holds all respective invoices, then you get - for the real, real-world list - just what was called list B so far using
B = df_Invoices["accountID].copy()
Then the solution already presented above is applied, after having dropped the duplicated IDs from B - similarly as described above.
Finally, the inner join as described above is re-applied, to get the ‘missing’ columns back.
ExcelForDiscussion = pd.merge(S3, df_Invoices, how="inner", left_on="AccountID", right_on="AccountID")
Save the dataframe as Excel, attach it to an email. Some polite text. Off it goes. Done.
Discussion and Contribution
For small data or problems of minor business impact, an Excel solution would be my personal choice. It saves me or you from the work of upload and download to and from Python, when it is an Excel sheet that is needed at the end. For bigger data - and you get an impression from the only picture here what 30 IDs can do to your eyes - or important business data, the roundtrip to Python might well be worth the effort. Particularly as the coding in Python is so straightforward.
Each component of the solution used here is well known in the respective community and discussed in much more detail, e.g. in the references given below. However, combining these components to provide the solution to a real-world problem is rarely described in detail.
I want to encourage to search for and to detect the pattern discussed here (of having to find an intersection and/or lacking entries). Hopefully, you get some inspiration from the components used here and my experience in using them.
If you happen to be using better components, a faster process or any other means to improve the solutions outlined here, please be assured of my interest.
Some References
During this example preparation, I consulted the sites linked below for the solution presented here.