Confusion Matrix
This section owes particularly to a single contribution, i.e. of Soren Laursen for the visualization of the various KPIs in a confusion matrix, see References.
The confusion matrix itself can be computed quickly using the Python library ‘sklearn’.
The confusion matrix consists of 4 values for a binary (Yes/No) prediction:
- TruePositive, e.g. YES/yes (TARGET IN CAPITAL LETTERS, prediction in small letters)
- FalsePositive, NO/yes
- FalseNegative, YES/no
- TrueNegative, NO/no
Solution
The algorithm ‘decision tree’ was applied to the categorization data set, but only allowing for one feature to be used. Expectedly, the predictions are usually not completely correct, because more than one feature was used to make up the target value.
For a random run for the dataset, the number of employees accepting the offer (value = 1) is typically greater than the number of those rejecting. For a prediction using an ill-parameterized decision tree, the sums for the acceptances typically differ from the targets. Moreover, the individual forecasts are sometimes not correct.
The chart below shows a result for a concrete run:
- 32 employees who declined were predicted correctly.
- 52 employees who accepted were predicted correctly.
- 7 employees who declined were predicted to accept.
- 9 employees who accepted were predicted to decline.
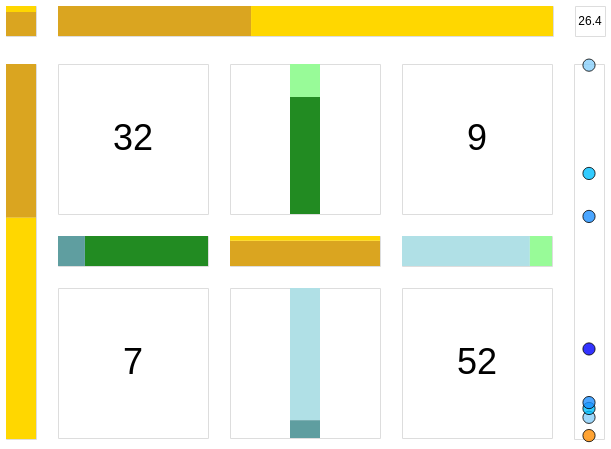
Confusion matrix and many derived KPIs for the Categorization Data Set and Prediction by an ill-parameterized Decision Tree
Solution idea and some details
The library ‘metrics’ by sklearn is used here.
from sklearn.metrics import confusion_matrix
cf = confusion_matrix(df.Result.tolist(), df.Prediction.tolist())
dfCM = pd.DataFrame(cf)
You can print out the dataframe holding the confusion matrix to the console or forward it to create the chart.